Let's work with some basic symbology:
1. Police Stations (single symbol)
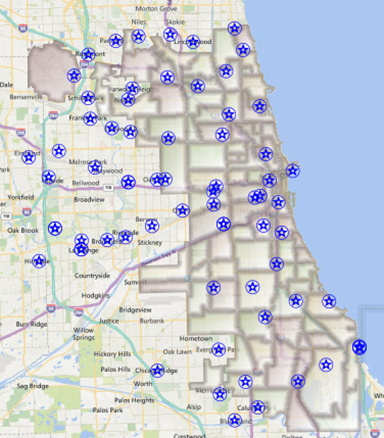
Let's try symbolizing the police stations with a Sheriff's star.
- First, select a "Font Marker"
- For font, select "GSI Map Symbol"
- Select the symbol that looks kinda like a Sheriff's star
2. Neighborhoods
Next, we'll make the neighborhoods pop out a bit more. QGIS has some good options here:
- For symbol, "select gradient fill"
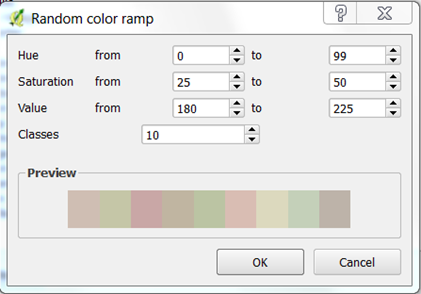
- For color ramp, "select random"
- Alternatively, create a custom ramp and choose your own hue, saturation and value ranges.
I've chosen muted reds/browns:
- Then,classify by neighborhood name
- For more effects, click the "Draw effects" button.
Here's an example using "Inner glow" and "source":
Play around a bit, and come up with a style you like.
3. Crime (choropleth)
QGIS also has standard options for classifying data and constructing choropleth maps. Try this out yourself - see if you can show neighborhood crime counts from the previous section using a graduated color scheme.
In the next section, we'll use blending modes in QGIS to create a bivariate choropleth map.