Heat Map Instructions
Heatmaps are a graphical representation of point data which are used to visualize the diversity of data. Heatmaps are used to easily identify clusters where there is a high concentration of activity. They are also useful for doing cluster analysis or hotspot analysis.
Prepare an address file
For this workshop, we will use two shapefiles, one for neighborhoods and the other will be a crime dataset. Instead of shapefiles, you could also use a .csv file as well.
Add the Data
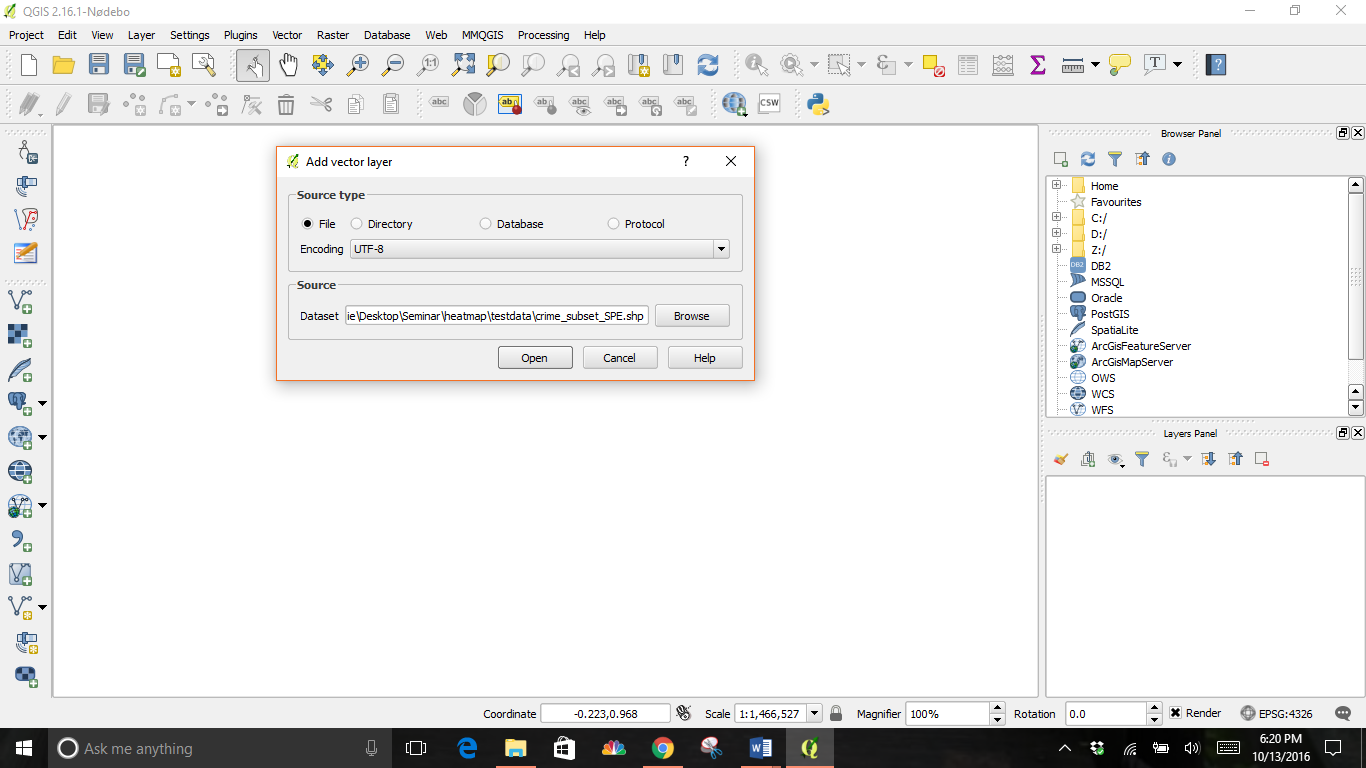
From the Layer dropdown menu, click Add Layer --> Add Vector Layer
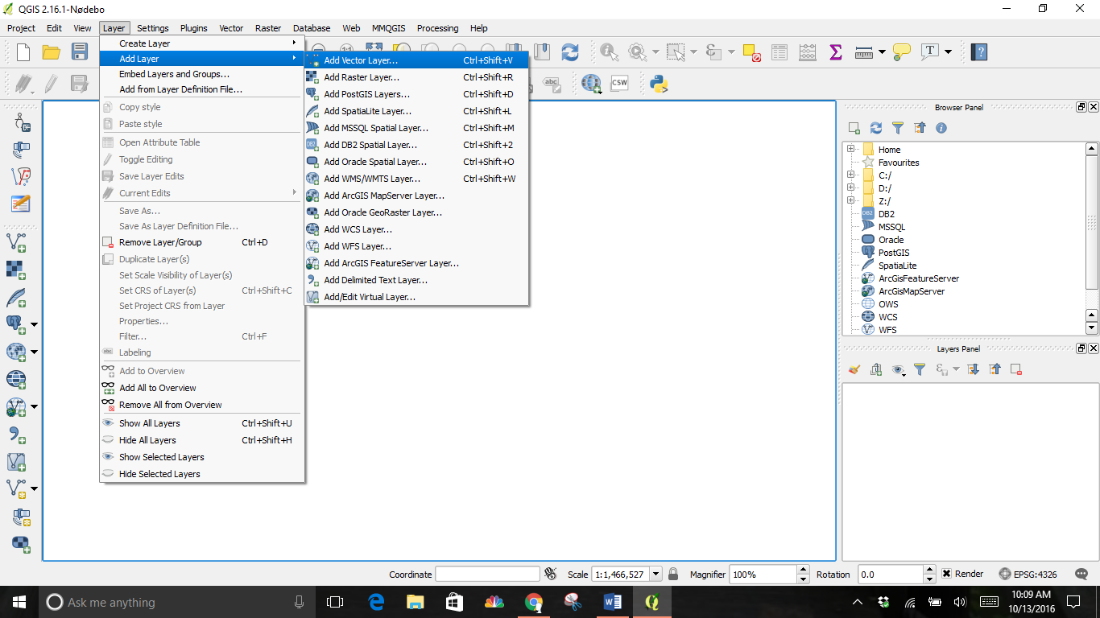
For this workshop, we are using the crime subset shapefile.
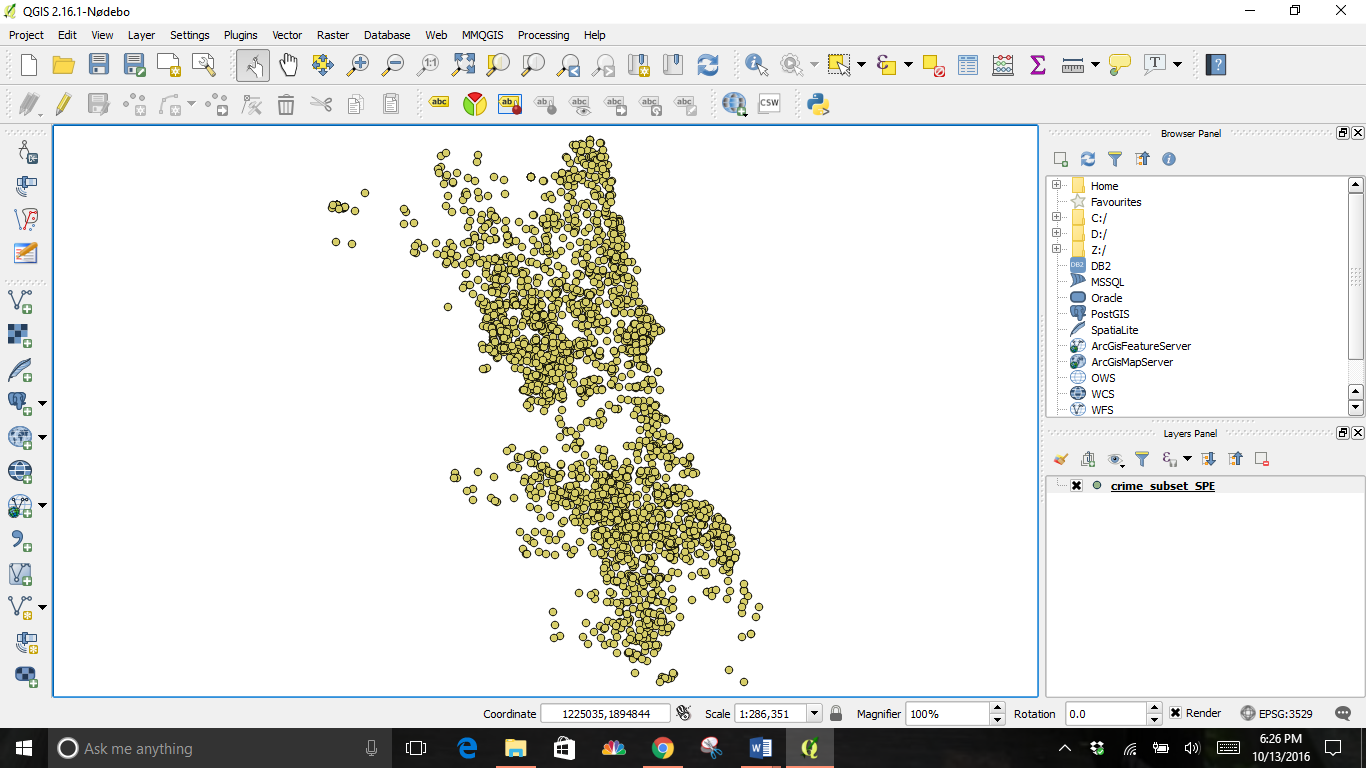
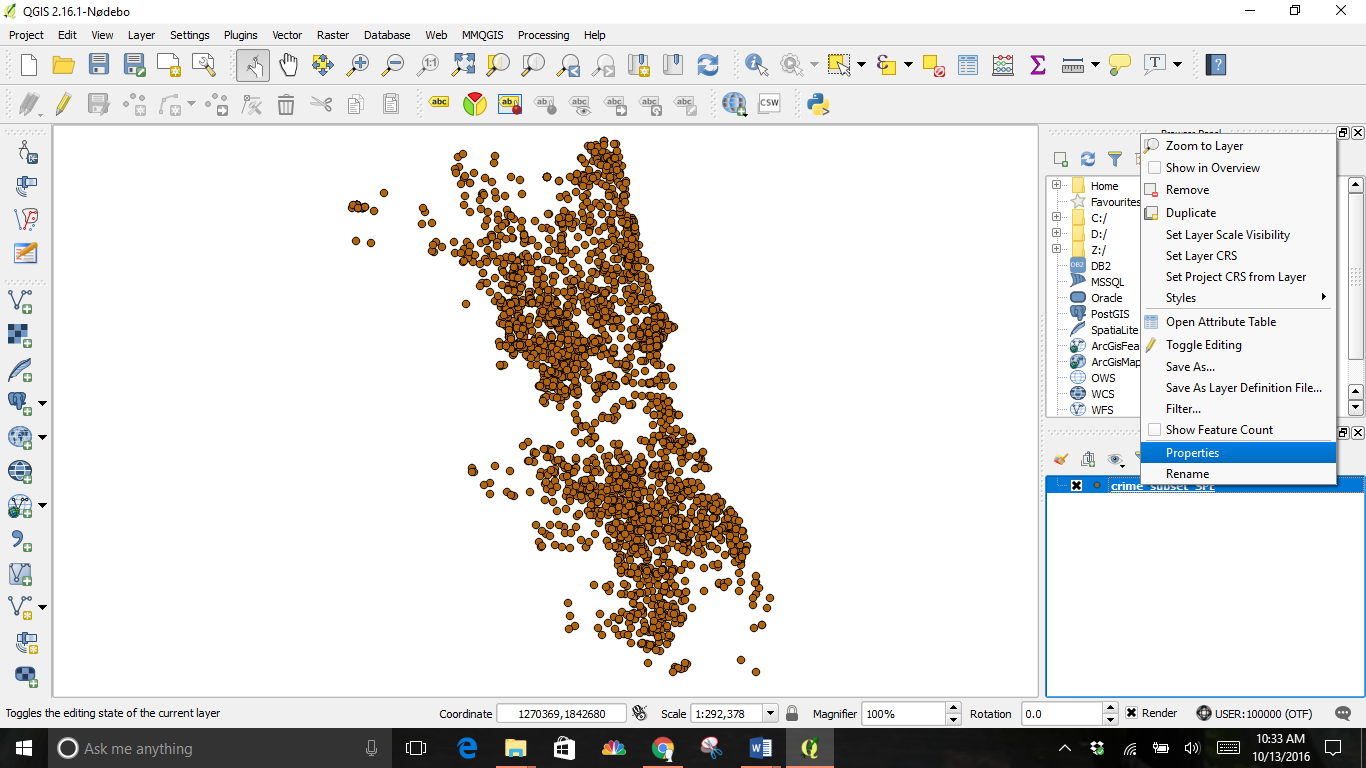
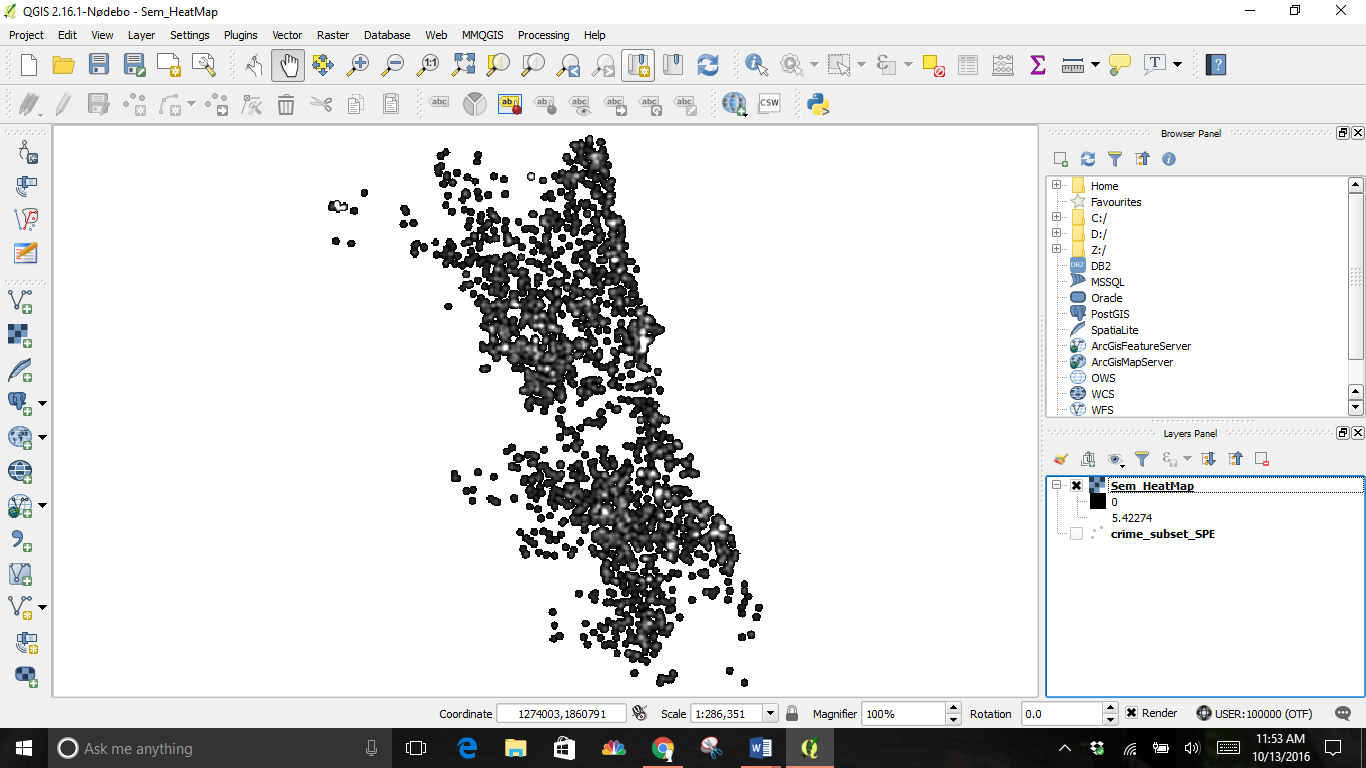
Which initially appears as points like this:
Construct a heatmap using the properties dialogue
For a simple heat map for visual or printing purposes, you could use the built-in symbology in the Properties dialog. Do this by right clicking on the layer, then clicking on Properties.
Next, from the Styles tab, choose Heatmap from the top drop down menu.
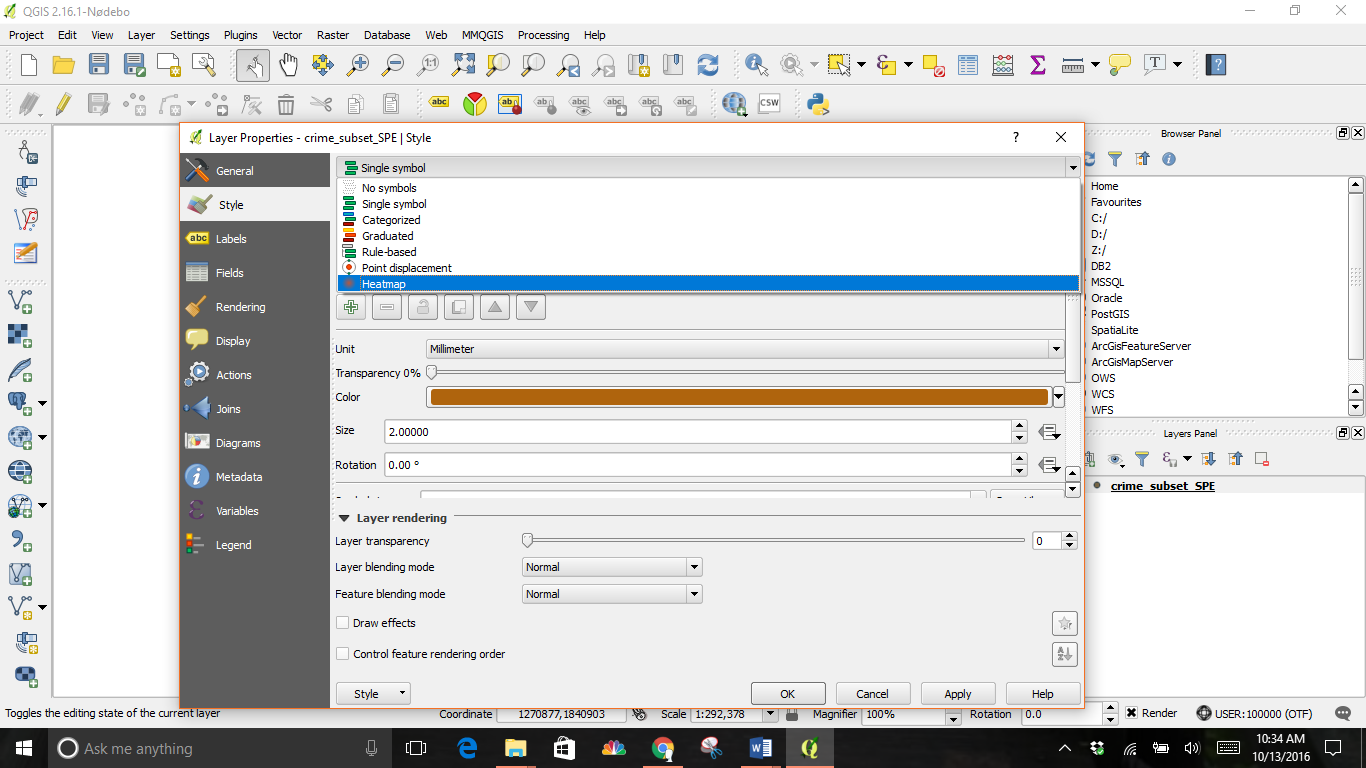
Then change the Color. I went with the Orange-Red (OrRd) colorramp.
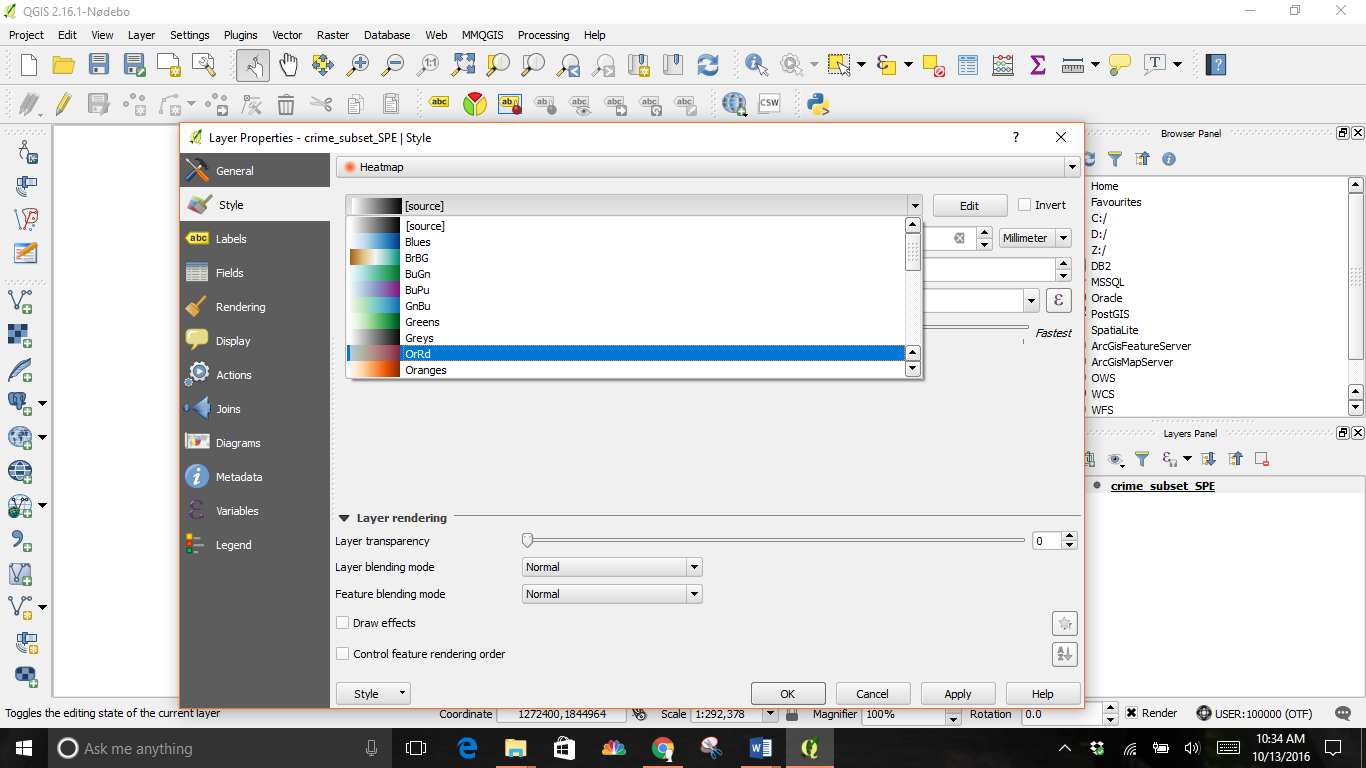
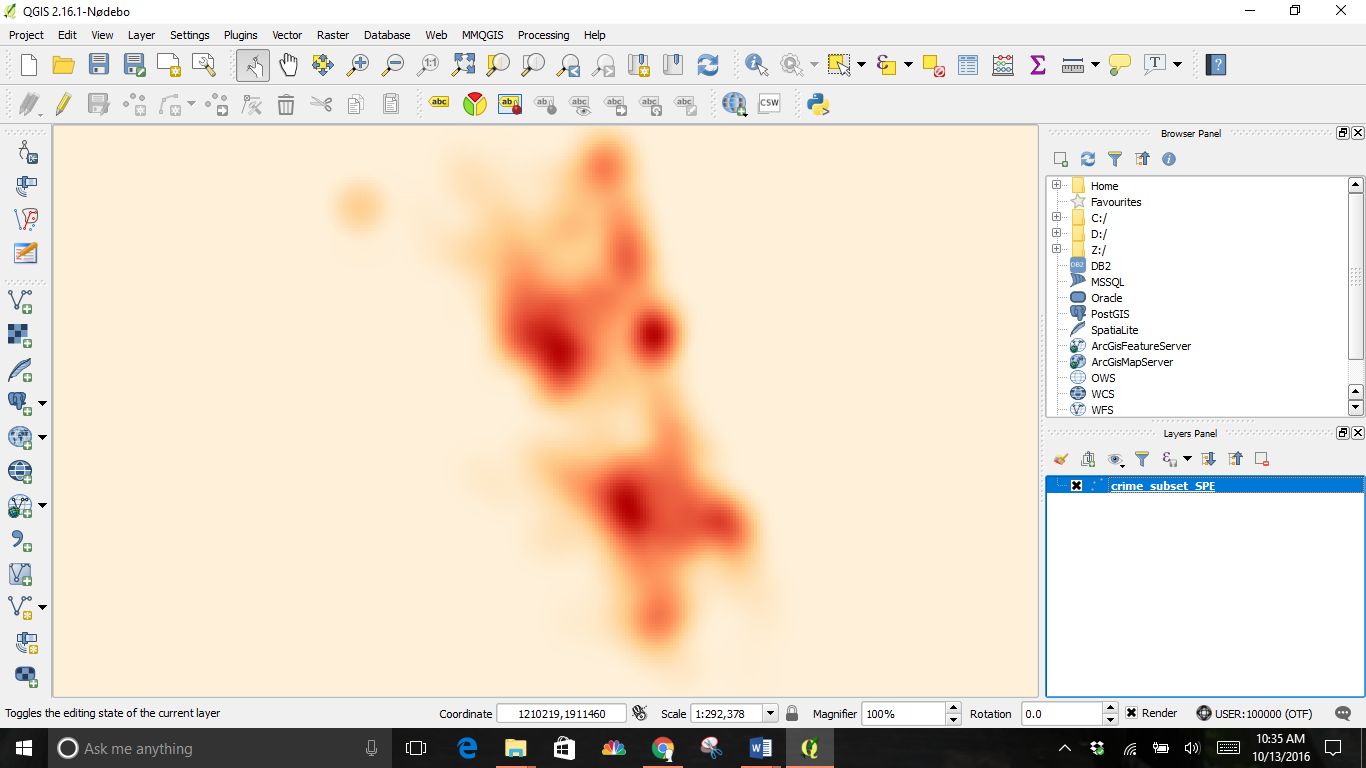
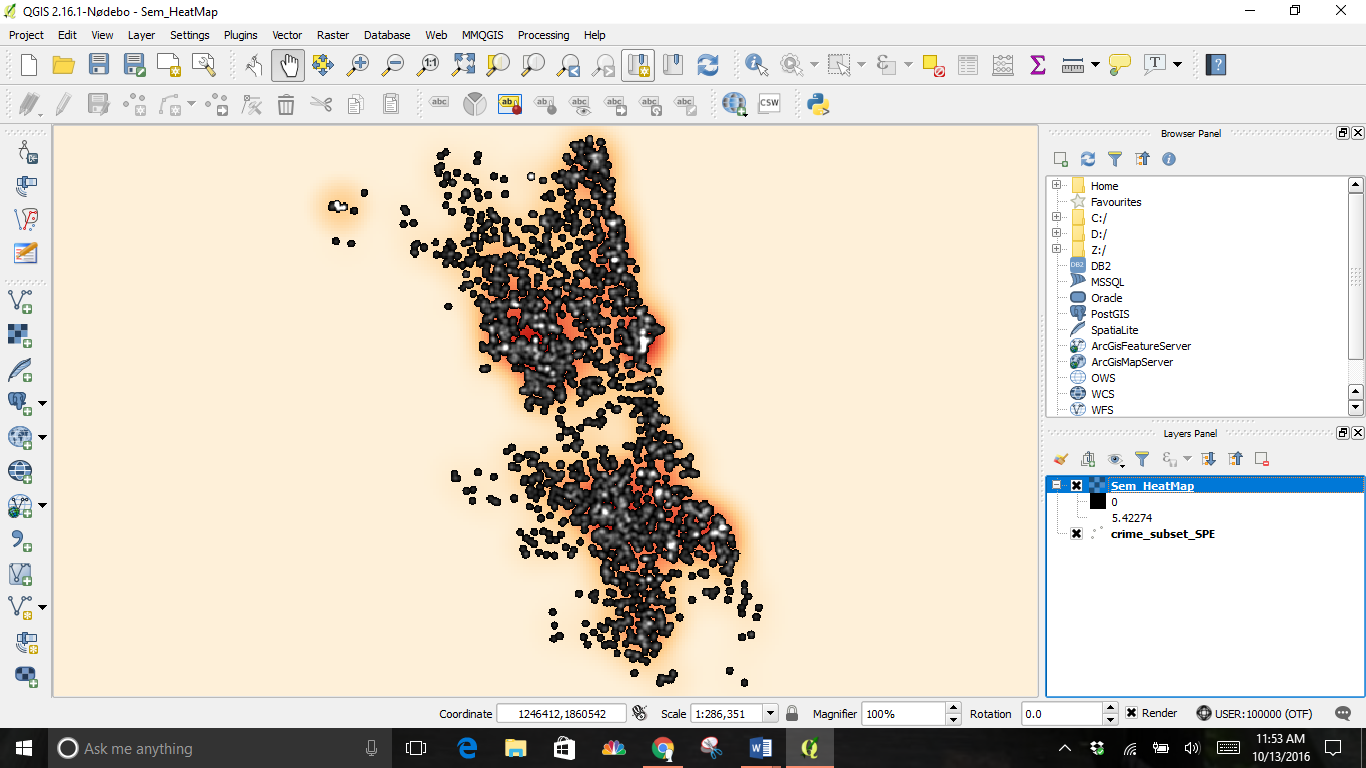
Click OK and you will see an image like this where the darkest areas are the highest concentration of crime:
Construct a heatmap using the Heatmap Plugin
Enable the MMQGIS Plugin
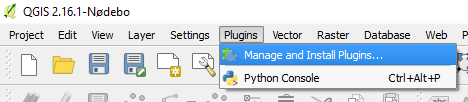
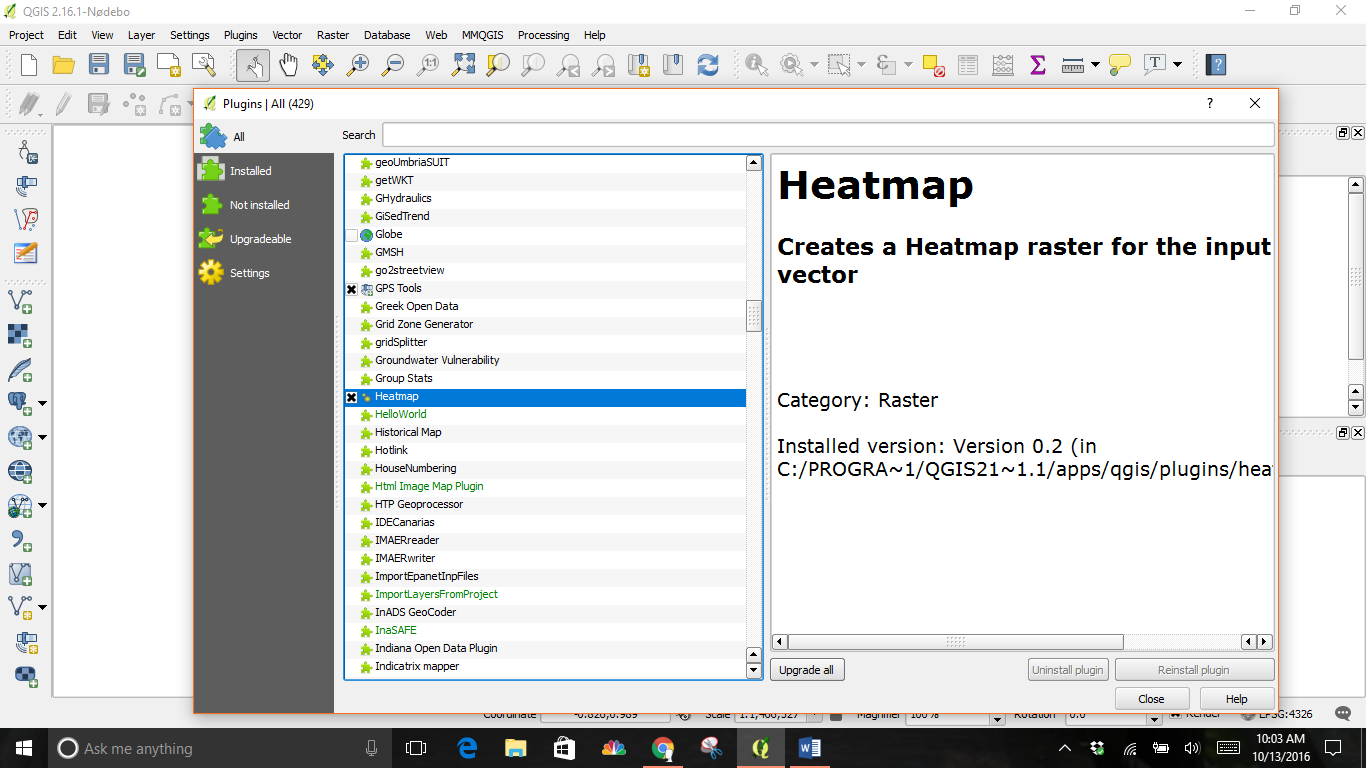
From the plugs in menu, click Manage and Install Plugins, then scroll down and ensure the Heatmap plugin is installed and active.
Continuing with our crime subset vector layer
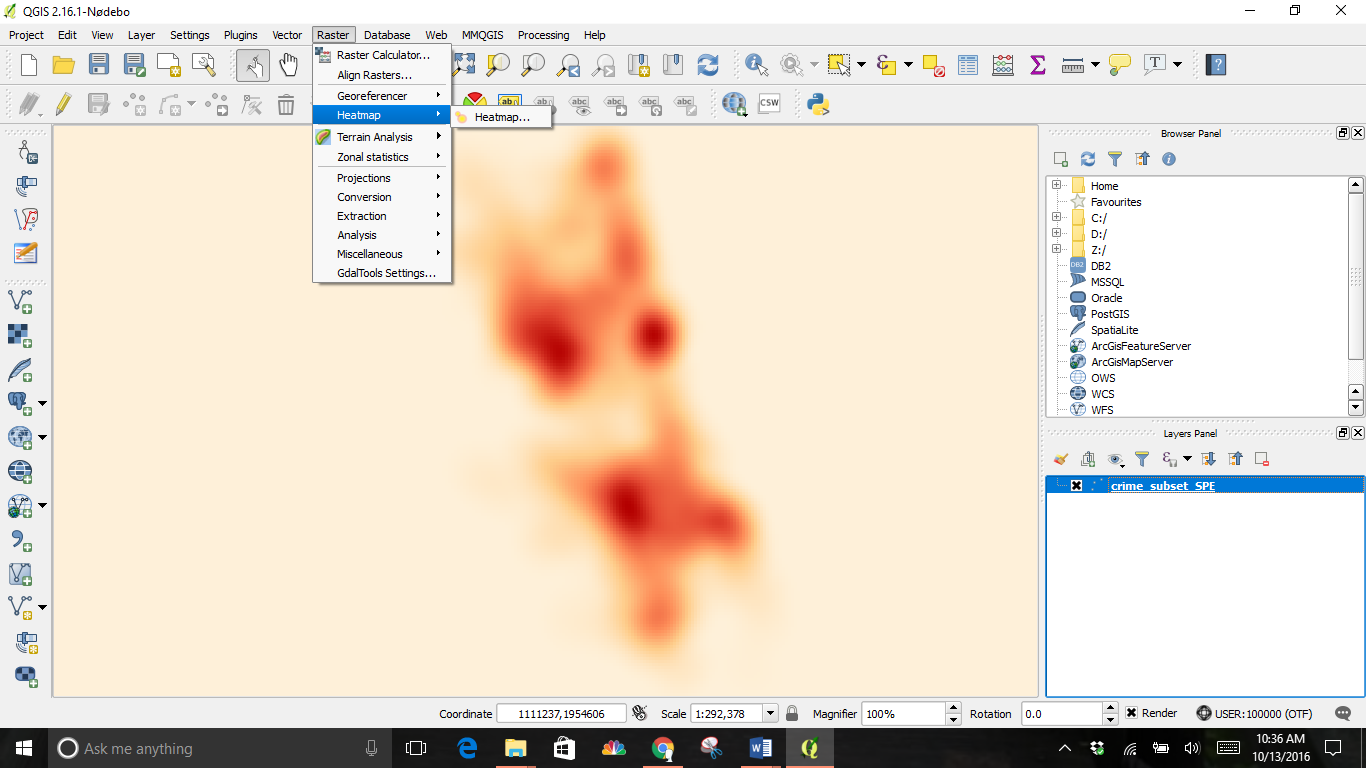
From the Layer drop down menu, click Heatmap from the Heatmap tab.
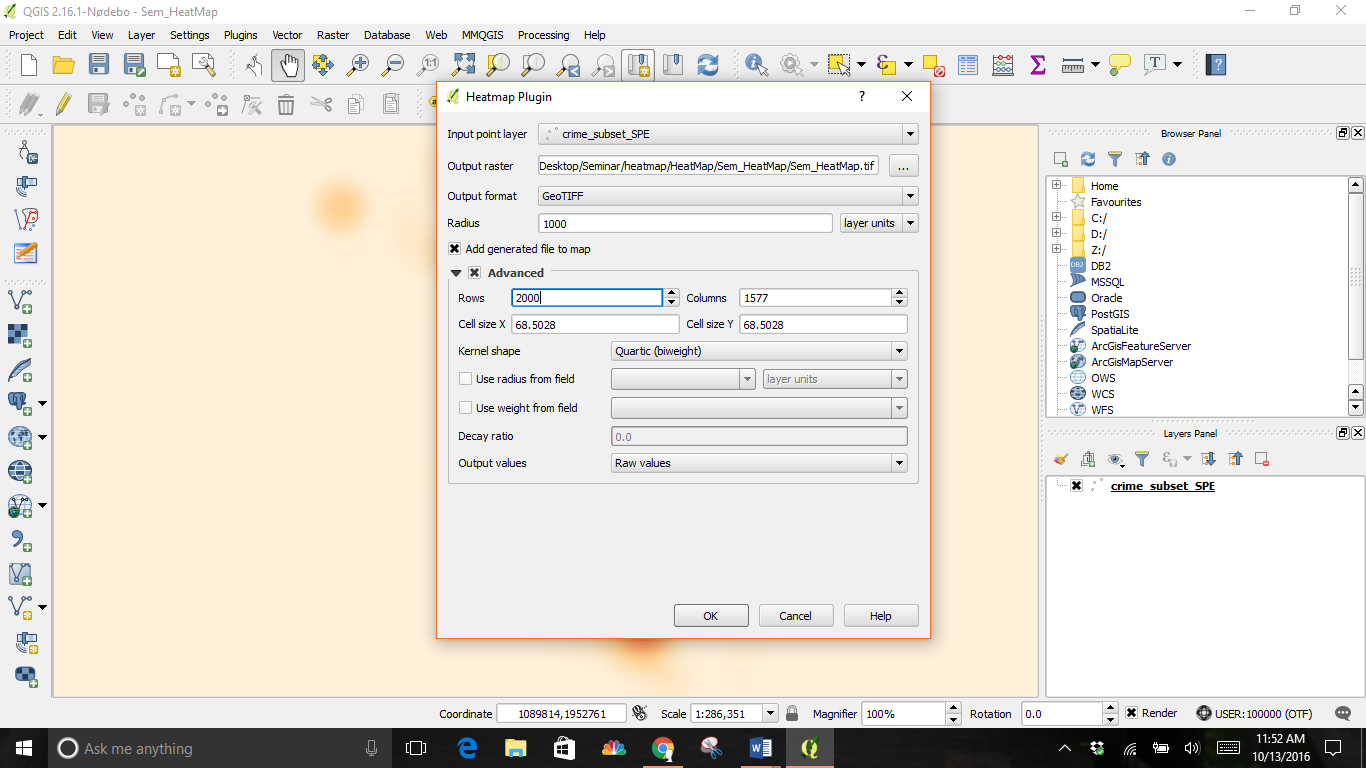
Next, select the crime_subset file as the Input Point Layer and select a location for the Output raster. I changed the Radius to 1000 and the Rows to 2000, the column adjusted itself.
The outcome is a new greyscale layer of a heatmap on top of the original
Turn the original layer off by unchecking it for the full effect.
We can make some visual adjustments from the Properties dialogue by right clicking on the layer to pull up the window and working from the Style tab.
- Change the Render type to Singleband pseudocolor.
- Select Min/Max
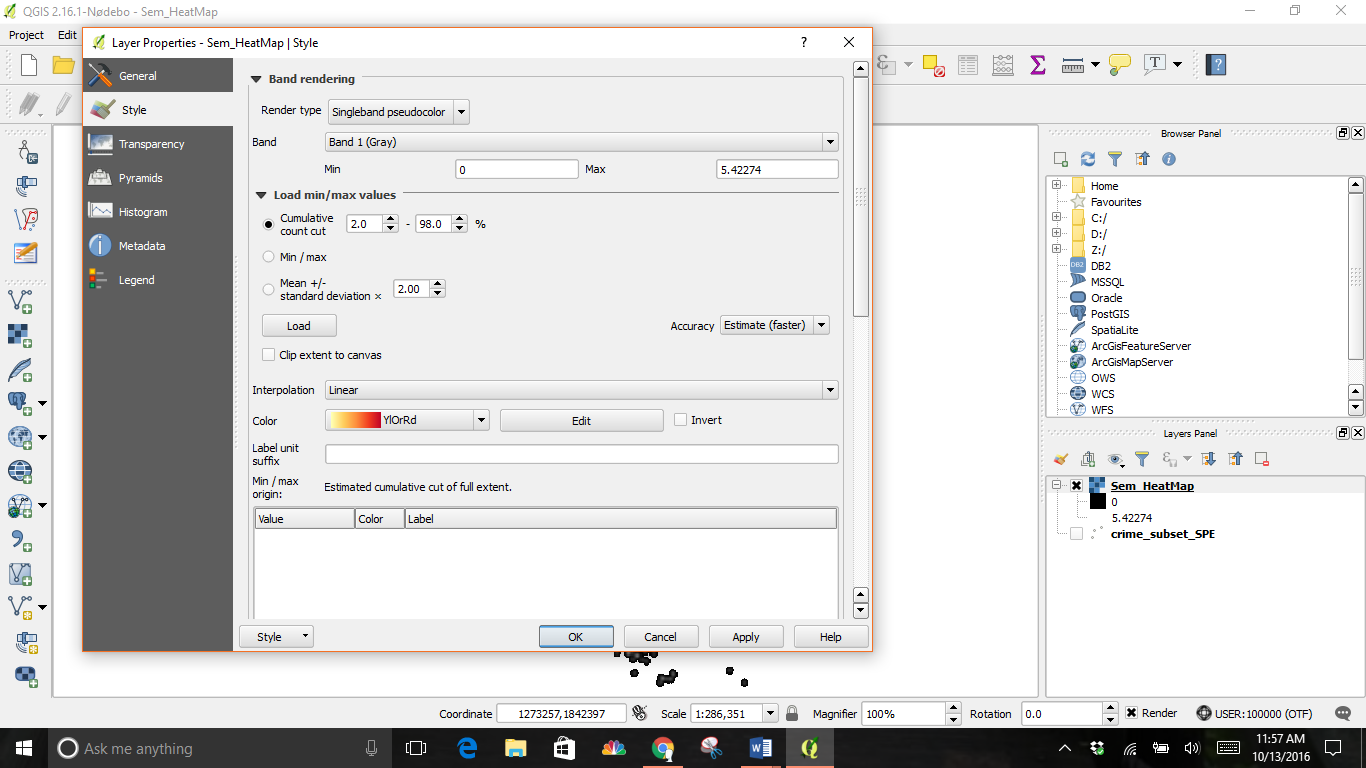
- Click on the Load min/max dropdown menus
- Select your color.
- Click on classify
- Select Load, then OK
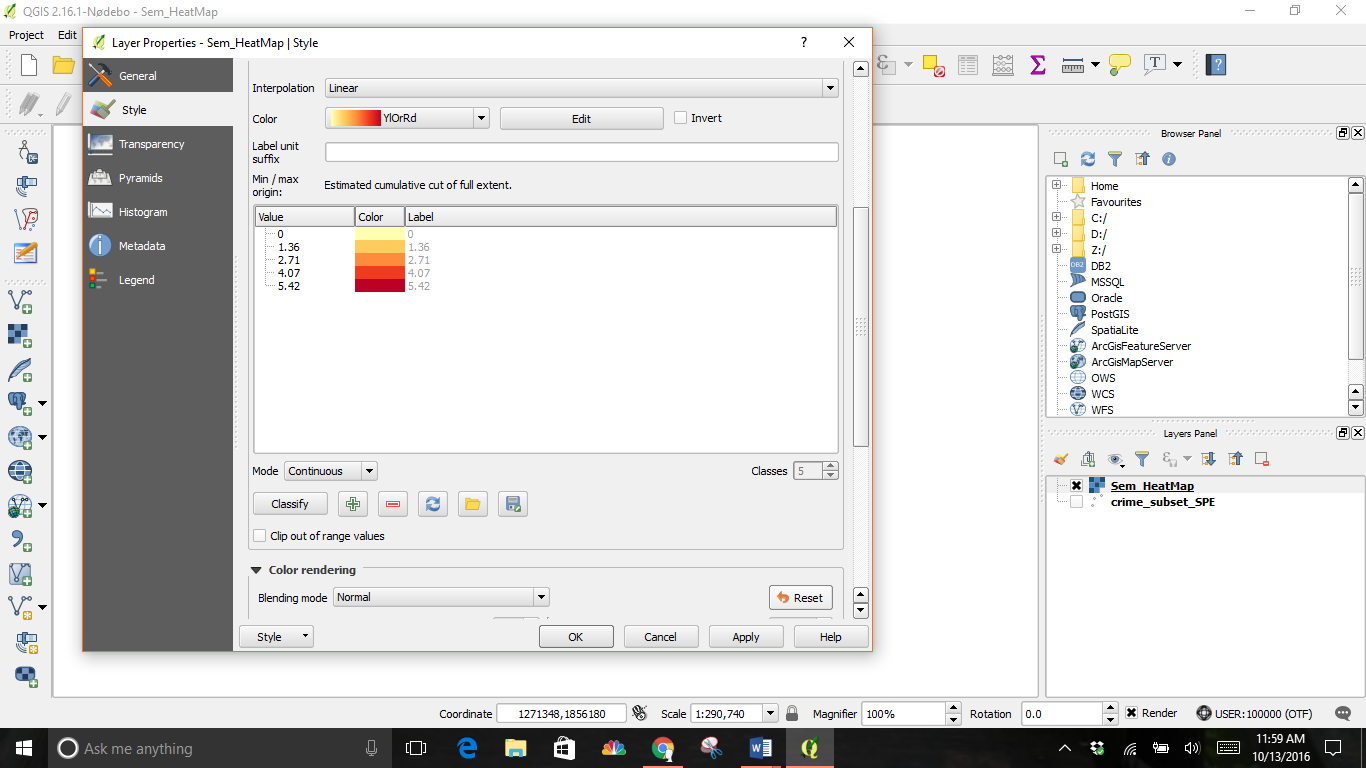
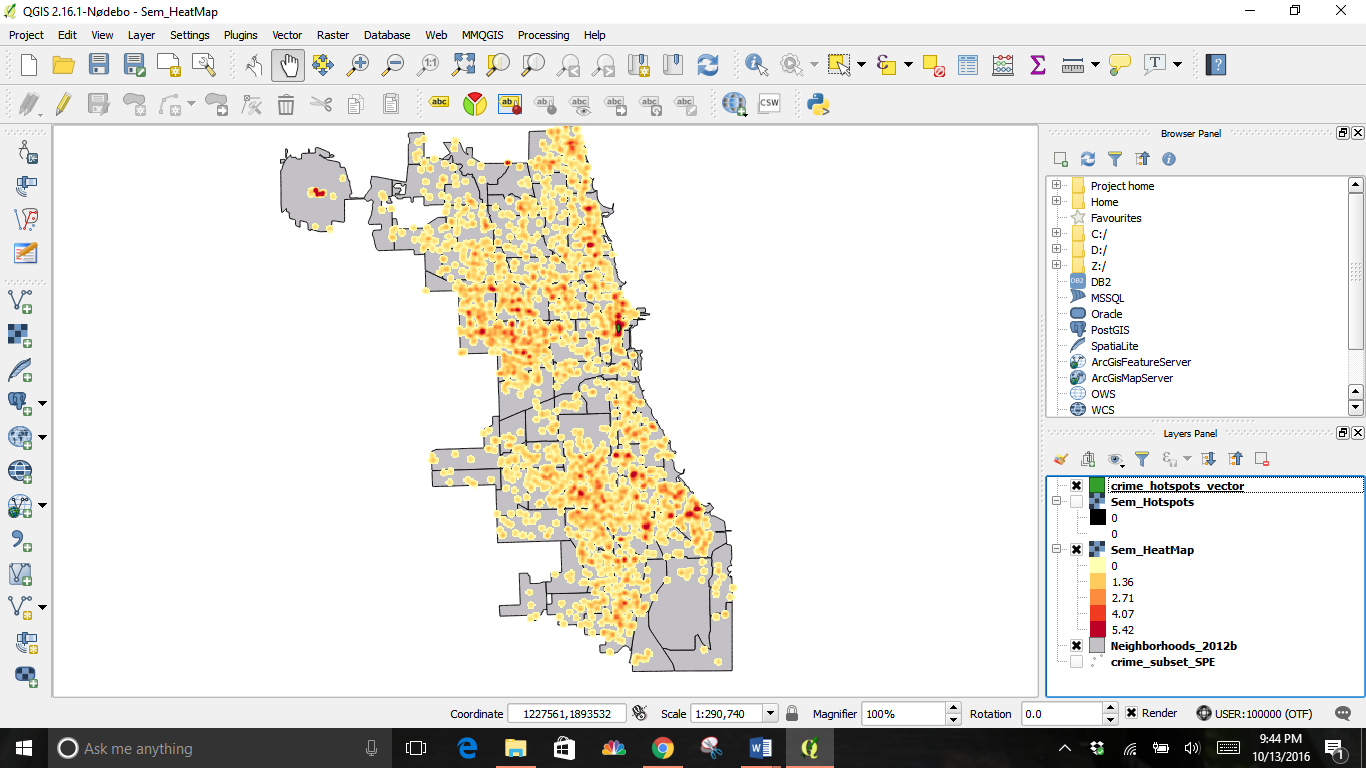
Your new heatmap will look similar to this:
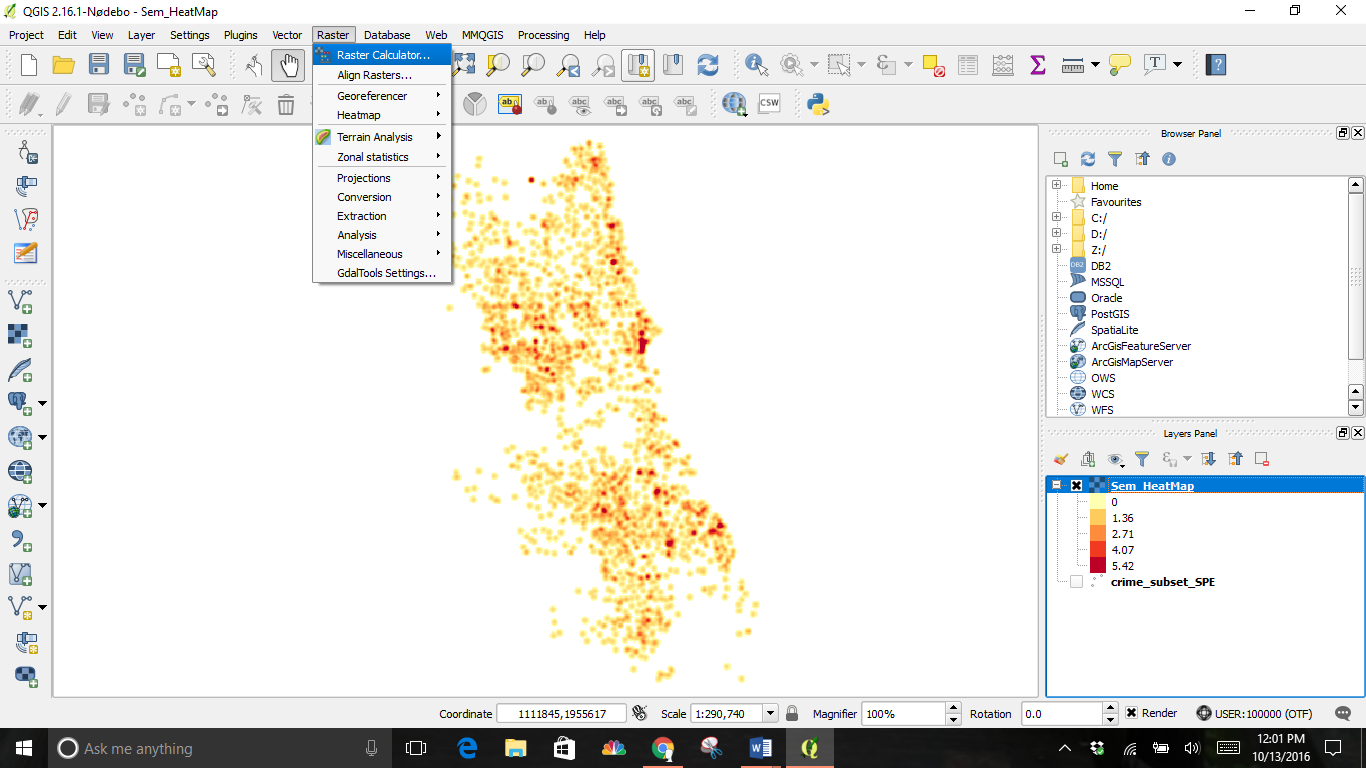
The Raster Calculator can be used to highlight the higher concentrations of crime. Select this tool from the Raster drop down menu.
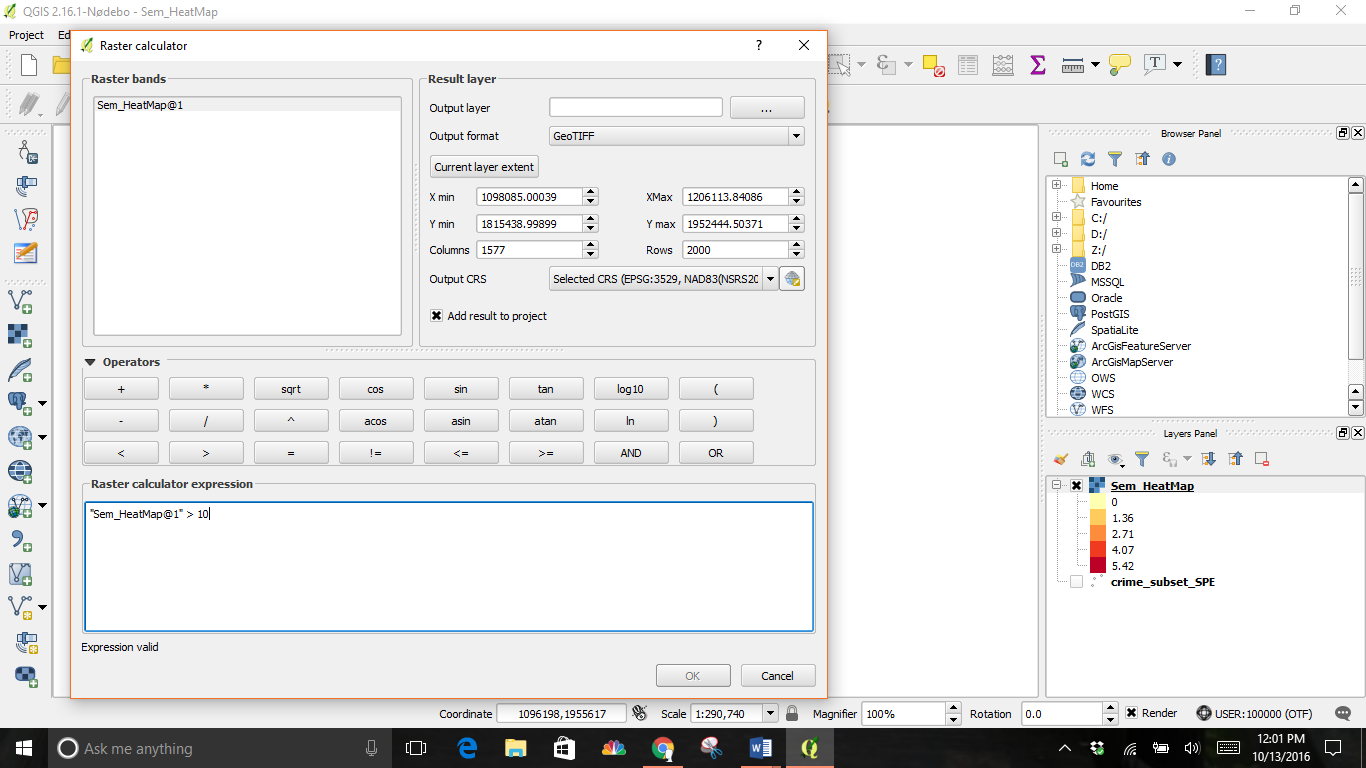
You will have to decide on a threshold value first. I chose 10 for my example. All pixel values above that threshold will be considered to be in a cluster.
In the Raster calculator dialogue choose an Output layer name. Then, double click on the item in the Raster bands window, my example is Sem_HeatMap@1. This copies the selection to the expression window. Next, add” > “ and your threshold (10 as used in the example) to complete the expression.
Check the box next to Add result to project and OK.
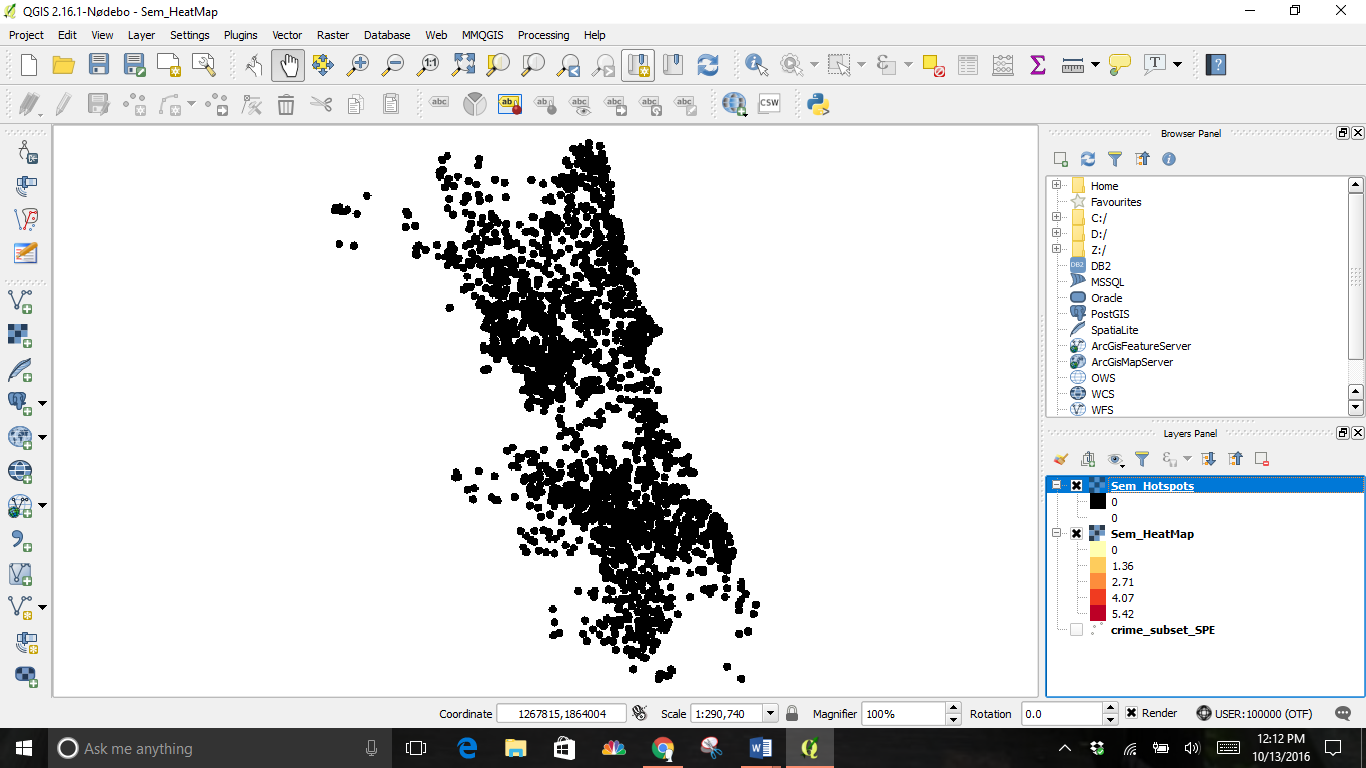
The result will be a new layer; the example is titled Sem_Hotspots. This layer has pixels with values of either 0 or 1. All pixels in the input layer where the pixel value was larger than 10 now have a value of 1 and all remaining pixels are 0.
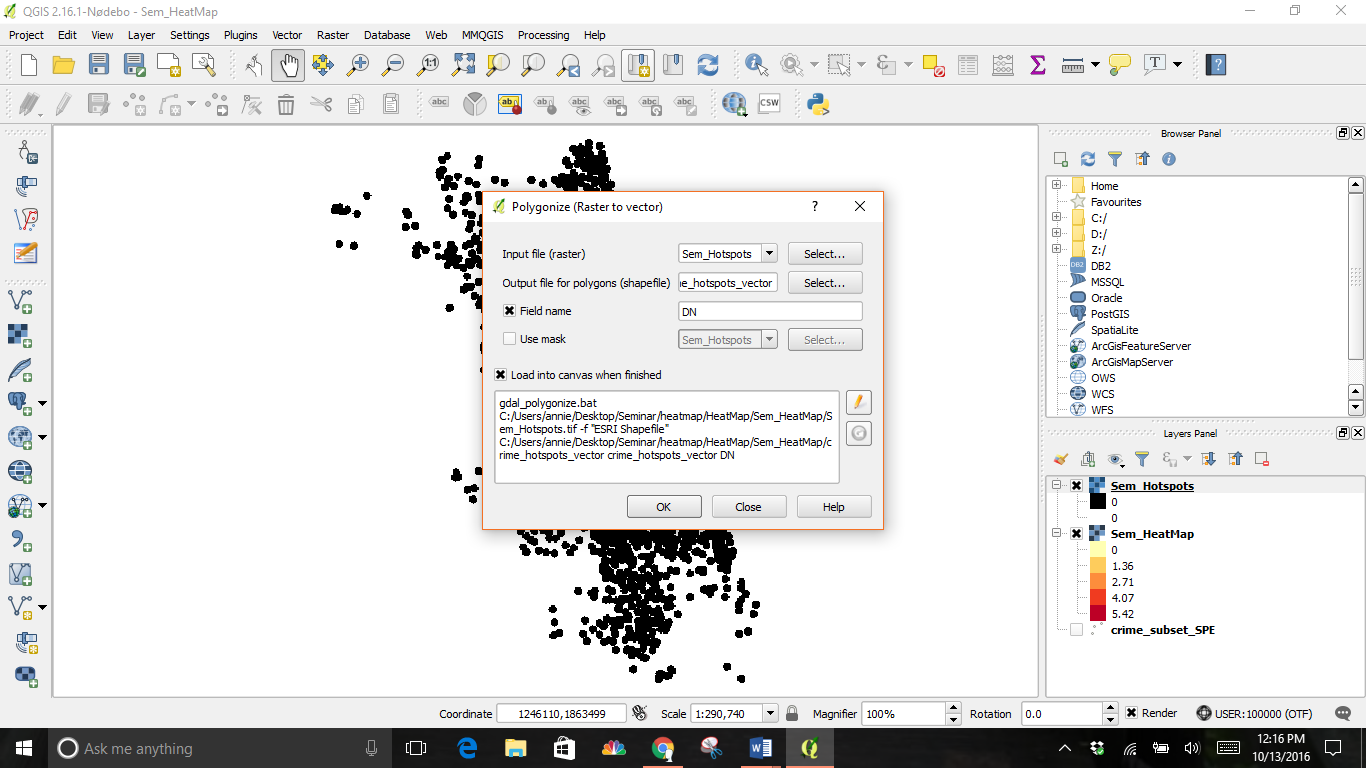
Next, click on the Raster drop down menu, then Conversion, and Polygonize (Raster to Vector).

Select where to save your file and give it a name.
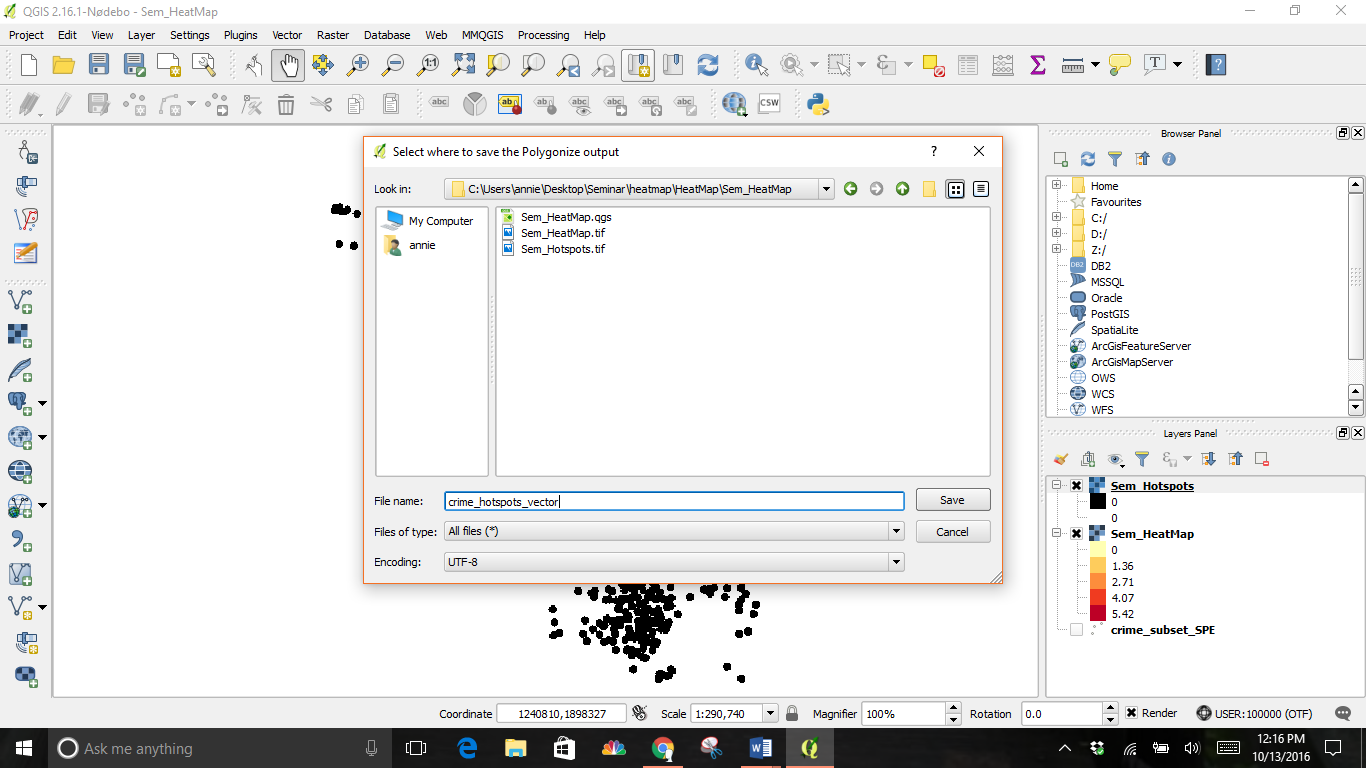
Check the boxes next to Field name and Load into canvas when finished.
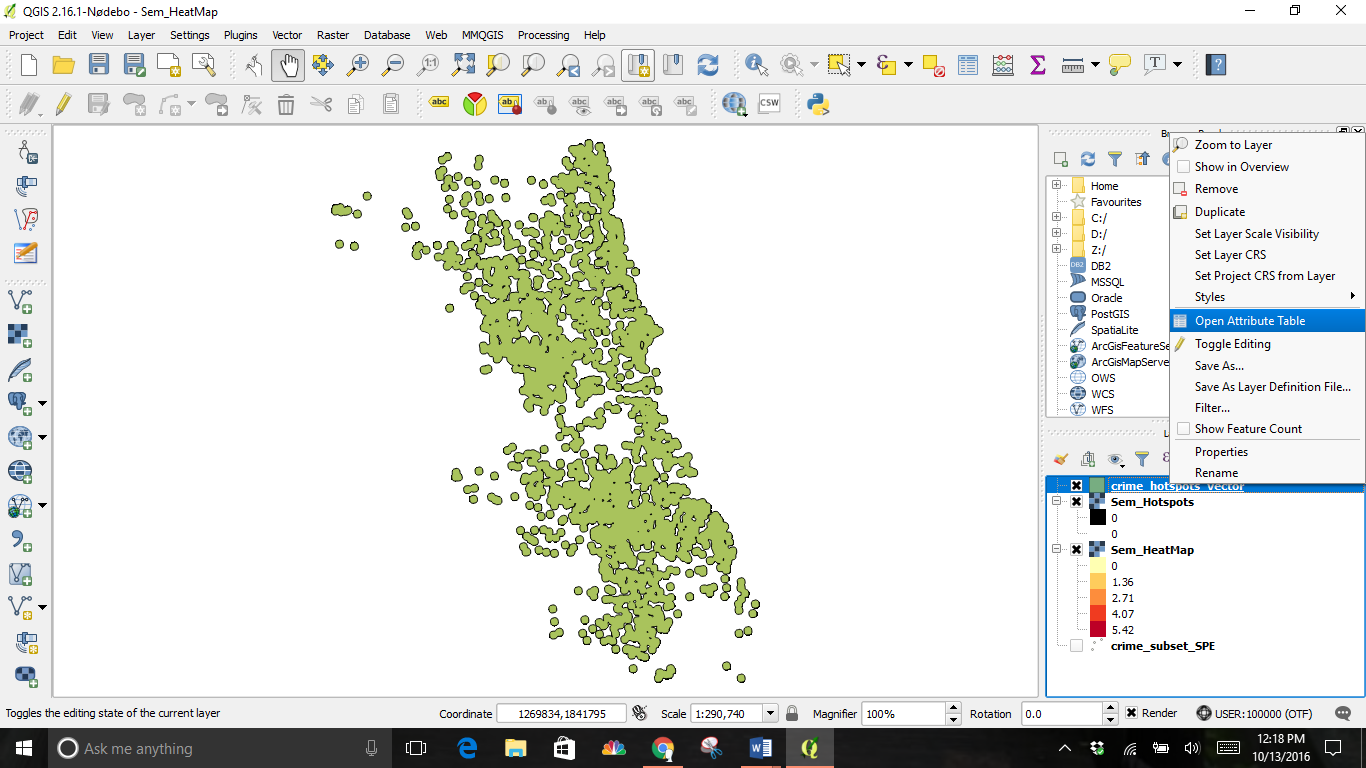
This conversion is another new layer. This is the vector representation of the clusters that were created in the previous step. The layers contain clusters with both 0 and 1 values. By filtering out the 0 values, will we get the clusters of hotspots. Right-click on the layer and select Open Attribute Table.
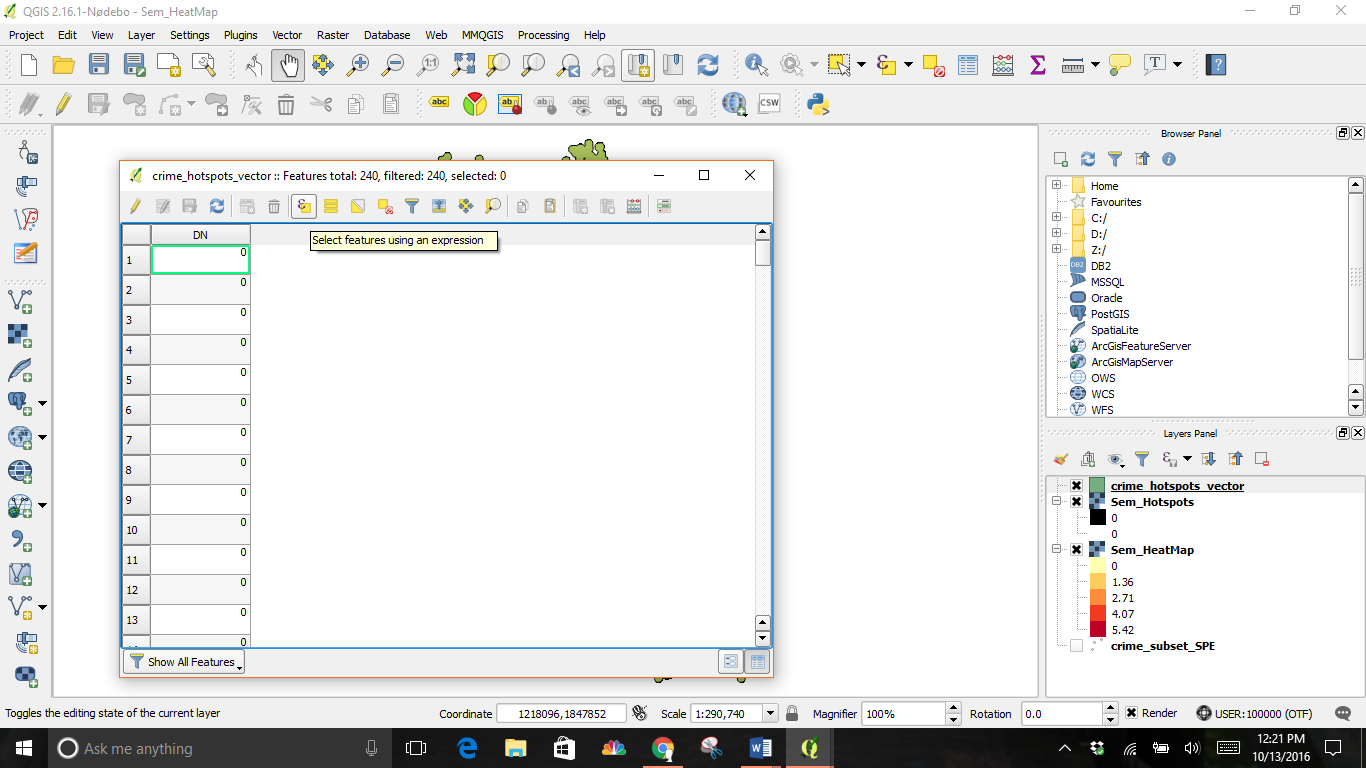
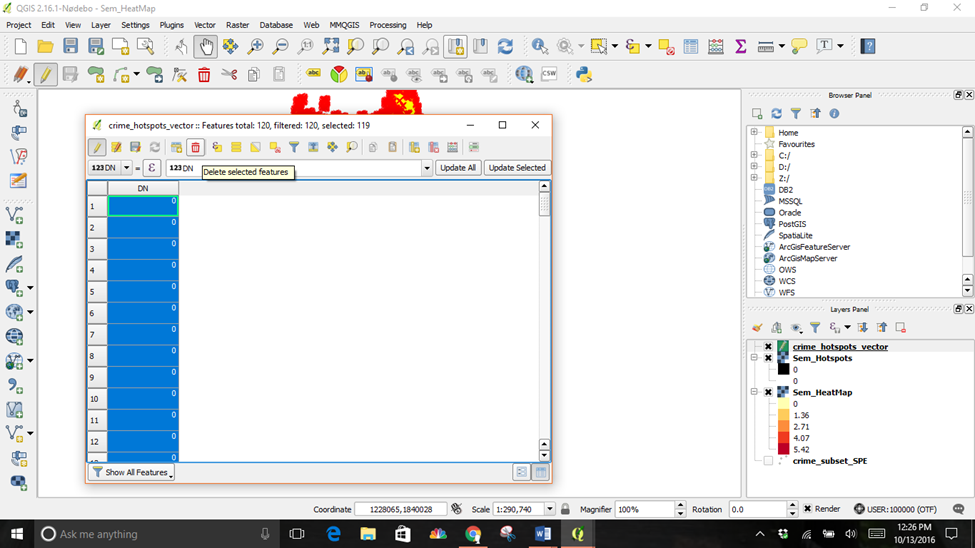
Click on Select features using an expression
Double click on DN under the Fields and Values Function and finish the expression with “=0”.
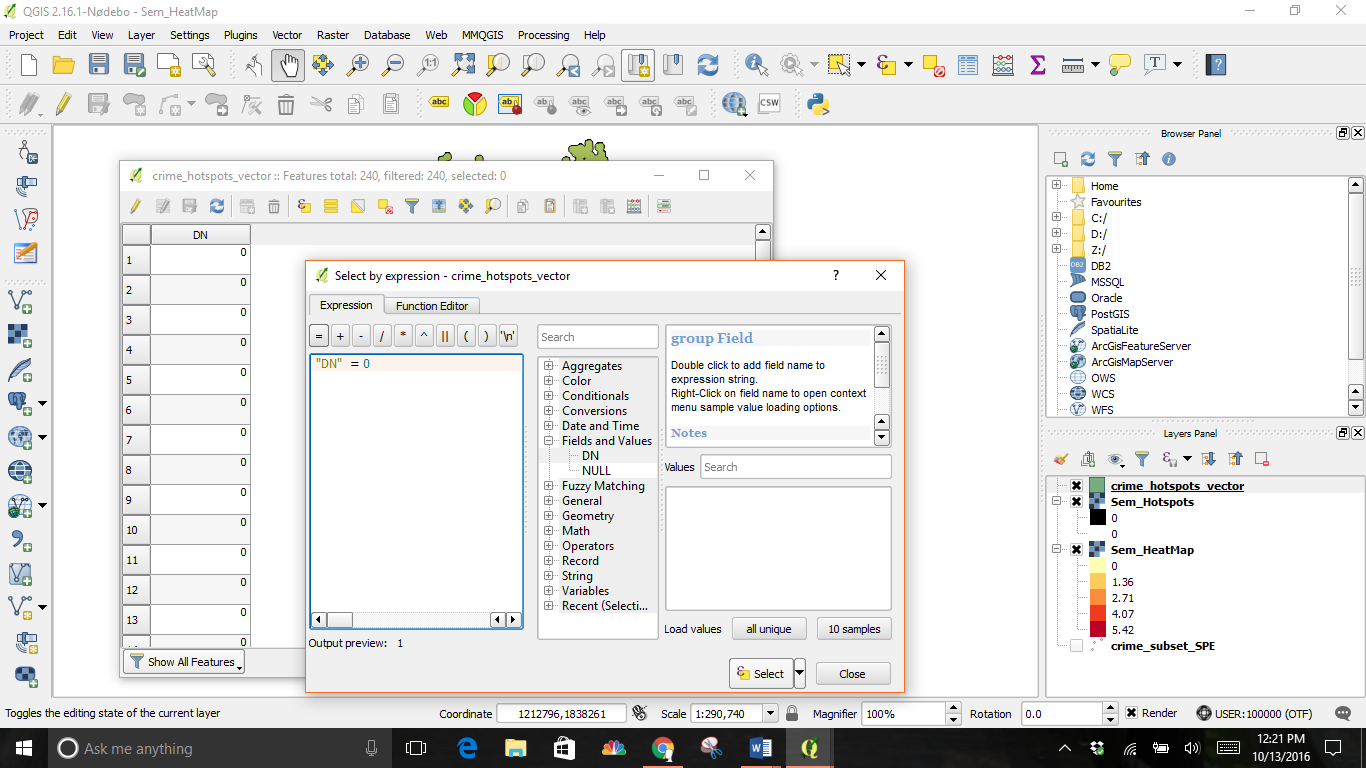
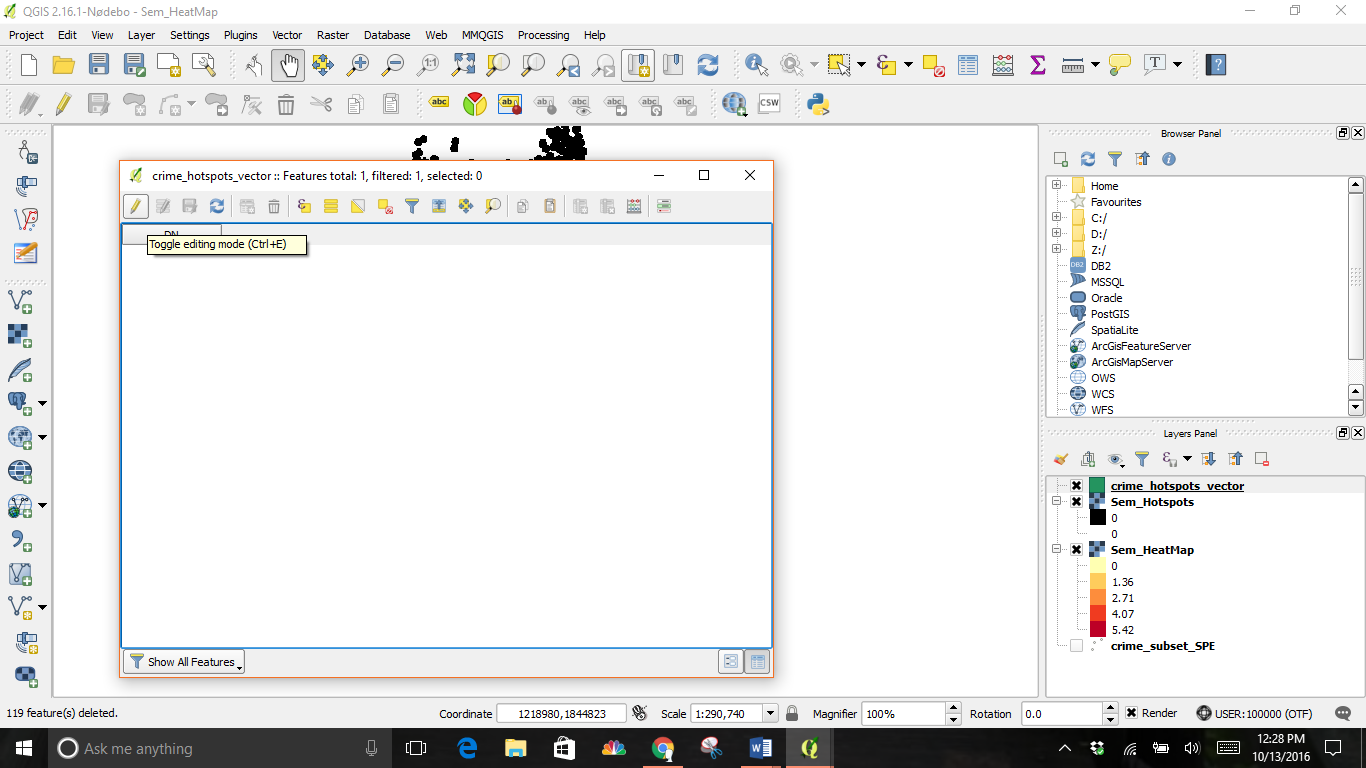
The expression DN=0 selected all values of 0 in the table. Click the Toggle editing mode button in the toolbar and then click the Delete selected features (DEL) button.
Click the Save Edits button and then Toggle editing mode again to put the layer in read-only mode. Close the attribute table window.
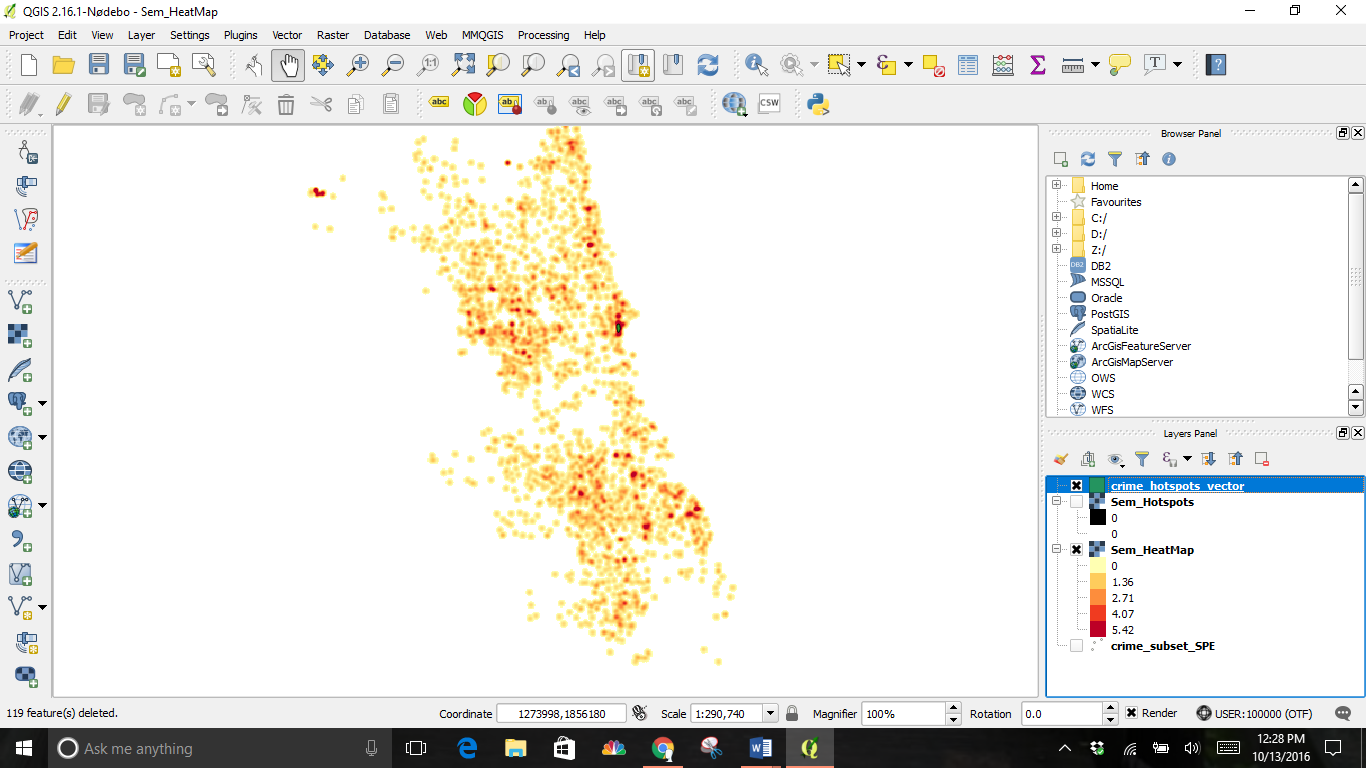
This is the result of both layers.
Add a base layer for reference by going back up to the Layer drop down menu and selecting Add a Layer, then Add vector layer. For the example, I chose the neighborhood shapefile.
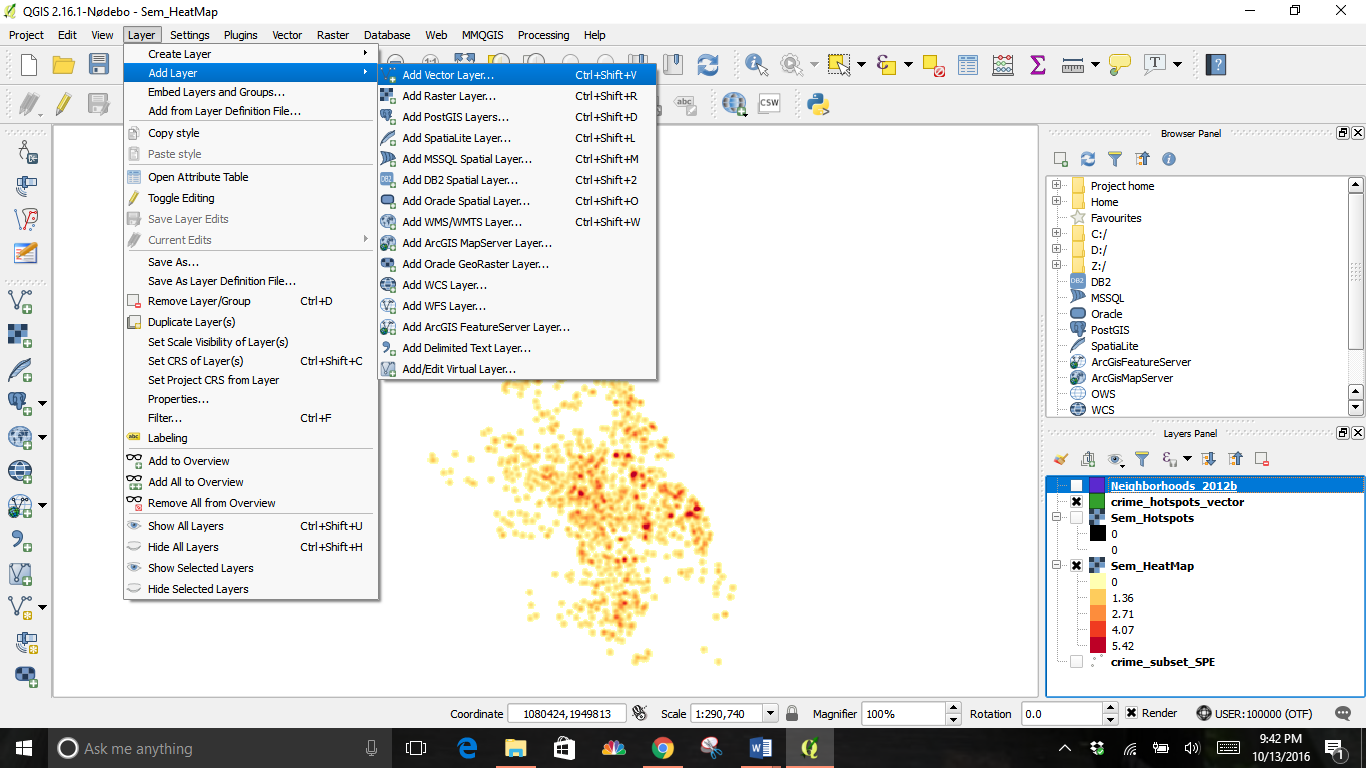
Click and drag the layer to the bottom of the Layers Panel to make the others visible.